
The Scarcity Myth: What It Would Take for Every American Household to Have Enough
A secure life costs more than many Americans have, even as the country’s surplus wealth pools far above what any household functionally needs.
Americans waiting in a soup line (1930s) | FDR National Library
America has long treated economic scarcity as an unavoidable condition. There is not enough housing, we are told. Health care is too expensive and education cannot be made broadly accessible without unbearable cost. Good food, stable work and safe neighborhoods are treated as limited resources, available to some and out of reach for others.
Yet the country is not poor. We are not lacking in homes, food, capital, labor or productive capacity. What America lacks is a serious public accounting of where its abundance goes.
And to understand where abundance goes, we first have to define what security requires. What would it actually take for every American household to have enough?
What Does "Abundance" Actually Cost?
Before we can talk honestly about scarcity, we have to define abundance.
Abundance is often treated as a synonym for luxury, as though the word belongs to people with excess.
But in a functional society, abundance begins much earlier. It means the resources a household needs to live without chronic precarity: stable housing, sufficient food, accessible health care, reliable transportation, affordable child care, working utilities, meaningful education and enough savings to withstand a routine emergency.
A car repair should not become a catastrophe. A medical appointment should not require a household to choose between treatment and rent. A child’s care should not depend on whether a parent can survive another month of impossible arithmetic.
Measured this way, abundance is not indulgence. It is the material foundation of dignity.
In 2023, that foundation cost a family of four in the United States over $100,000 a year in total resource value. The number is striking because it does not describe a lavish life in the slightest.
And that distinction matters in a country where millions of people are told to budget their way out of conditions that were never designed to support them.
That threshold is not merely theoretical. It is supported by research on income and well-being.
In 2010, economists Daniel Kahneman and Angus Deaton found that day-to-day emotional well-being rises with income, but only up to a point.
Their research placed that threshold at roughly $75,000 a year. After that, additional income continued to shape how people evaluated their lives overall, including whether they felt successful or satisfied with their circumstances.
But it no longer appeared to substantially improve the quality of their daily emotional experience.
Adjusted for inflation, that figure lands close to $108,000 in 2024 dollars, strikingly near the threshold suggested by an abundance framework.
The picture became more complicated in 2021, when new research challenged the idea of a clear plateau.
Rather than leave the findings in conflict, Kahneman later collaborated with Matthew Killingsworth, whose work had reached a different conclusion, in what the researchers called an “adversarial collaboration.”
Their 2023 study, published in the Proceedings of the National Academy of Sciences, offered a more precise answer.
For most people, emotional well-being can continue rising with income. But for the least happy group, roughly the unhappiest 15 percent of people studied, the benefits of additional income appeared to level off around $100,000 a year.
Above that point, more money did not meaningfully relieve suffering, because the remaining sources of pain were less likely to be solved by resources alone.
That distinction matters. Poverty, housing instability, medical debt, food insecurity and the constant threat of an ordinary emergency becoming a crisis are resource problems.
They can be eased by money because money buys time, care, stability and options. But grief, heartbreak, bereavement and clinical depression do not disappear simply because a household has crossed into financial security.
The researchers put it plainly: “This income threshold may represent the point beyond which the miseries that remain are not alleviated by high income.”
In other words, once a household has enough resources to meet its needs and maintain basic security, money begins to lose its power as a remedy.
The threshold identified by happiness economics sits in roughly the same range as the abundance framework: around $100,000 to $110,000 a year.
For this analysis, the relevant metric is resource value: the combination of annual income, available assets and stabilizing buffers, including savings, home equity, reliable transportation and other forms of security that determine whether a household can withstand ordinary disruption.
The working threshold is $110,000. Below it, households are managing scarcity. Above it, they begin to have the material conditions for abundance.
The question, then, is who actually has it.
Mapping the Line Between Security and Surplus
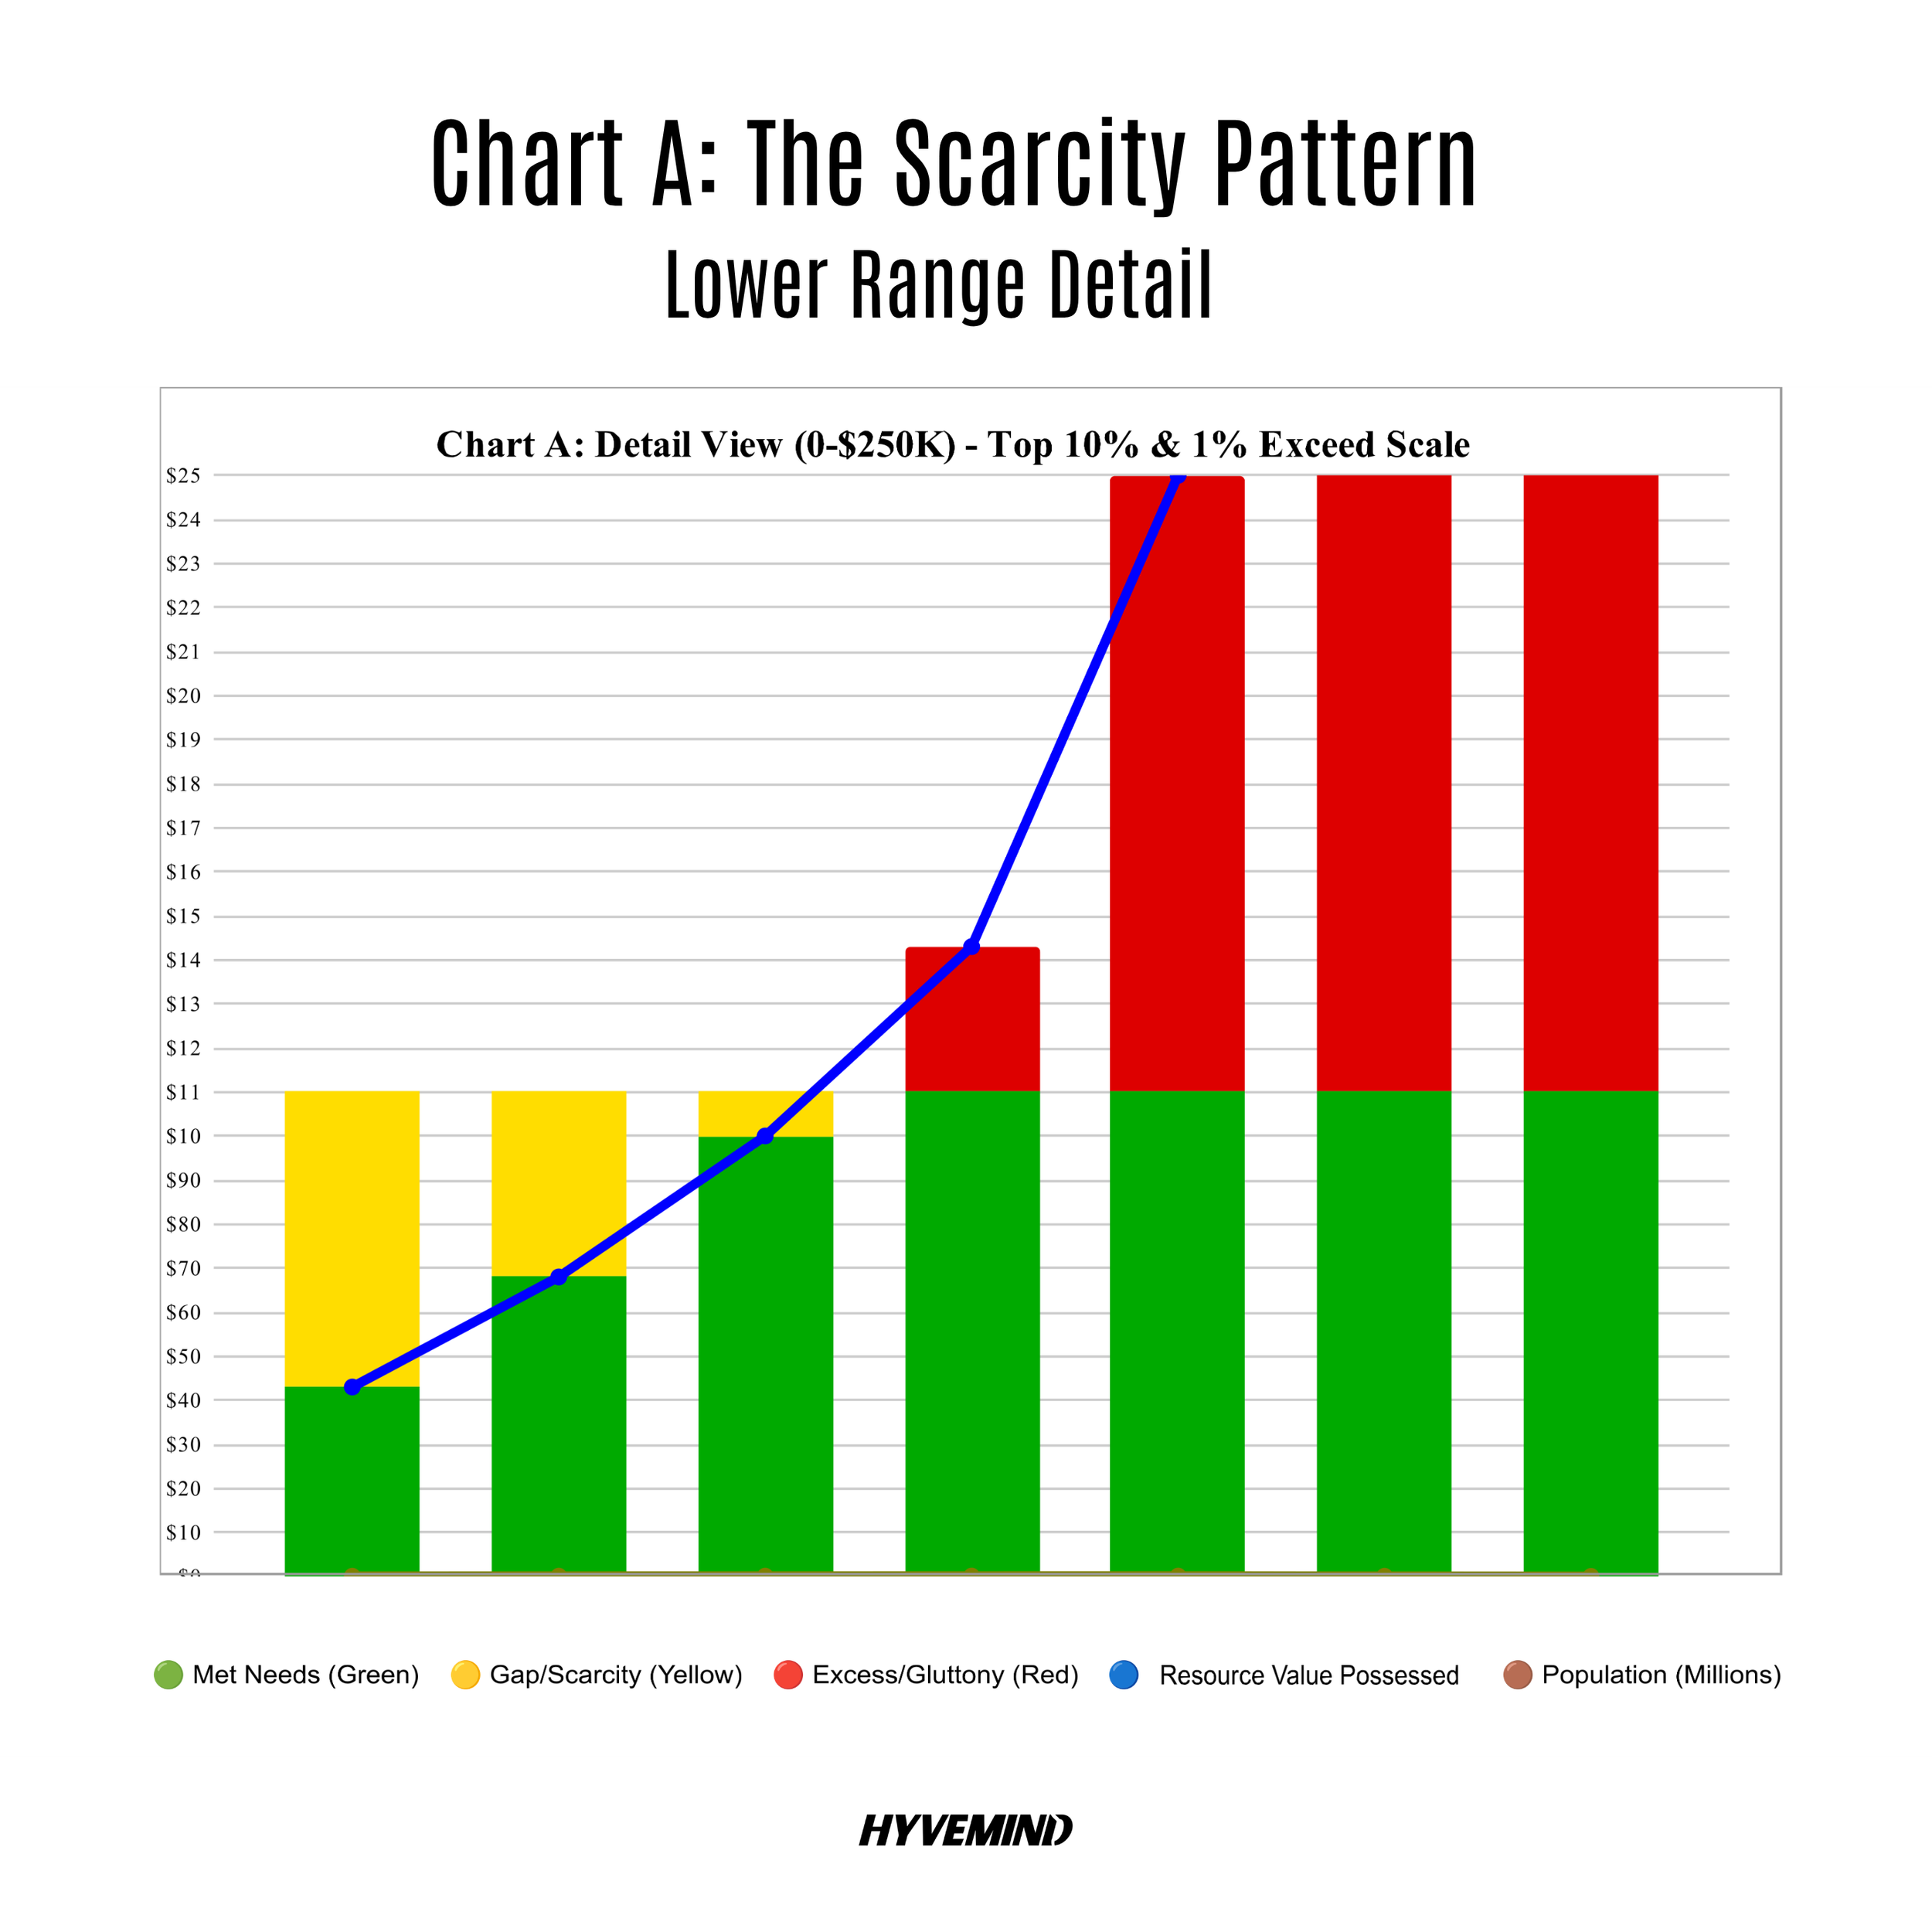
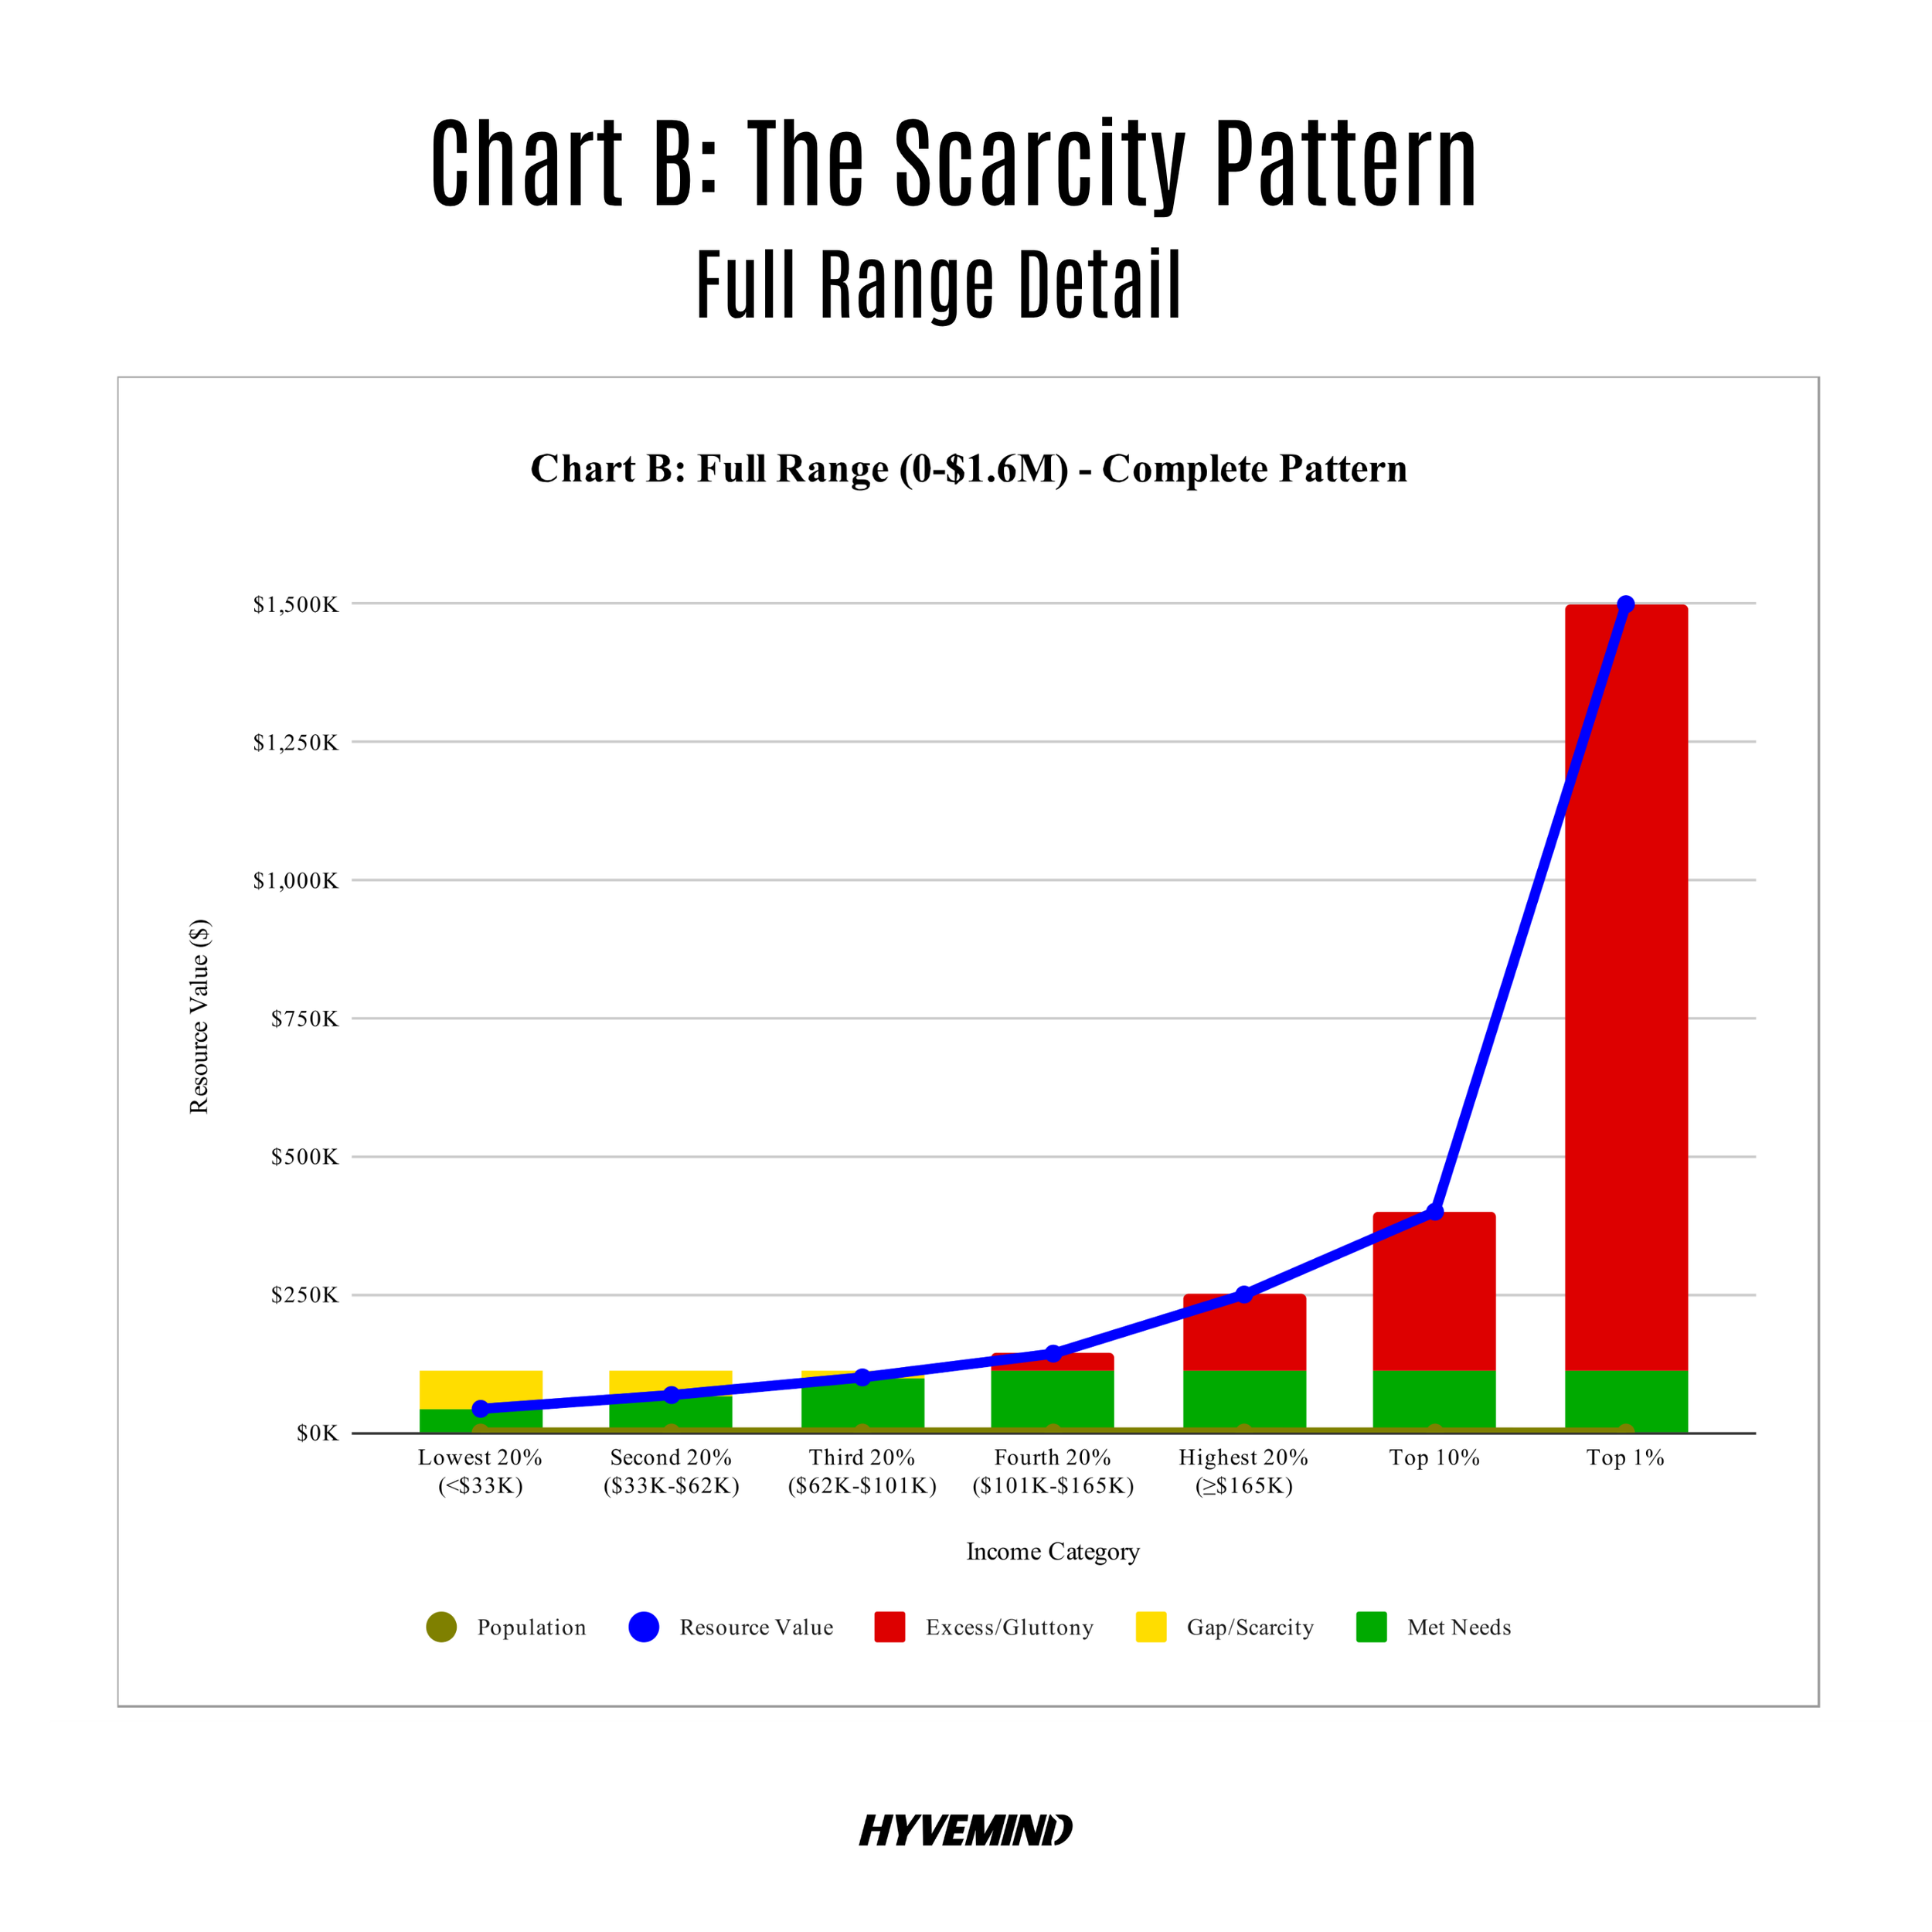
Chart A shows the scarcity pattern across seven income groups, from the lowest-earning 20% of American households to the wealthiest 1%. For each group, we measured the total resource value they actually possess—not what they earn, but what they have access to when accounting for both annual expenditures and asset cushions.
Chart B shows the same data on a larger scale with gridlines for every $250,000. This chart shows the full, unobstructed view of American resource distribution.
The blue line shows household resource value in possession starts at $43,000 on the left (bottom 20%) and climbs exponentially to $1.5 million on the right (top 1%).
The tan line shows more people live in higher-income households (47 million in the bottom quintile vs. 84 million in the top quintile) because wealthier households tend to be two-earner couples with children versus single individuals scraping by alone.
The household earner concentration makes the impact even more dramatic than it appears. Fewer households at the bottom (struggling individuals) support more people while more households at the top (dual-income families) hoard more resources per capita.
The Bottom 60%: Manufactured Scarcity
Lowest 20%
Households earning less than $33,000
They possess 39% of what they need. The yellow bar showing their scarcity gap is larger than the green bar showing what they have.
For renters in this income bracket (under $30,000), after paying housing costs, they have only $250 per month left for all other necessities—food, healthcare, transportation, utilities, everything (Harvard Joint Center for Housing Studies 2025). Try living on $250/month. That's the manufactured scarcity.
Second 20%
Households earning $33,000–$62,000
They possess 62% of what they need. Getting closer, but still in structural scarcity.
Third 20%
Households earning $62,000–$101,000
They possess 91% of what they need. So close you can see it—just $10,000 short of security. That equates to one moderate emergency or job loss away from crisis.
These three quintiles represent 60% of American households. Together, they contain approximately 176 million people. Every single one of them lives below the abundance threshold.
The Top 40%: From Comfort to Gluttony
Fourth 20%
Households earning $101,000–$165,000
The first group to cross the abundance threshold. They have everything needed for abundance, plus a cushion.
Highest 20%
Households earning $165,000–$300,000
They possess more than twice what's needed for an abundant life. At this point, the bars are turning red. Not a little red, a lot of red. But we're not done.
Top 10%
Households earning $300,000–$659,000
Nearly four times the abundance threshold. The red bar is climbing.
Top 1%
Households earning more than $660,000
Fourteen times the abundance threshold. Their red bar doesn't fit on Chart A. It literally exceeds the scale. We had to cap the chart at $250,000 to show the fine detail of the bottom 60%'s scarcity gaps. The top 1%'s excess is so grotesque it breaks through the ceiling.
The Pattern: Scarcity Is Gluttony
The yellow gaps on the charts—the scarcity experienced by 176 million Americans—are created by the red extensions at the top.
When the top 1% possesses resources valued at $1.5 million per household—$1.39 million more than needed for abundance—while the bottom 20% struggles with $43,000 (missing $67,000 of what they need), we're not looking at a "wealth gap." We're looking at resource hoarding so extreme it manufactures scarcity for everyone else, with the same pattern repeats across every category of need:
Housing: 15.6 million vacant housing units exist alongside 650,000 homeless Americans translates to 24 empty homes per homeless person. The bottom income quintile has a 47.1% homeownership rate while the top quintile has a homeownership rate of 81% (Census Bureau ACS, Minneapolis Fed 2023).
Why? Because the bottom quintile cannot afford to purchase a home in a market where investment properties and second homes concentrate housing stock at the top. Half of all renters (22.6 million) are "cost-burdened," spending over 30% of income on housing (Census Bureau, HUD, Harvard Joint Center 2024-2025).
Food: America produces 3,800-4,000 calories per person daily nearly twice what's needed, then wastes 30-40% (106+ million tons annually) while 44 million Americans experience food insecurity (USDA, EPA 2022).
Wealth: The top 1% holds 30.5% of all U.S. wealth while the bottom 50% holds 2.5%. At the 10th percentile, median net worth is literally $1 (Federal Reserve 2022-2024).
Healthcare: $4.9 trillion annual spending, 1.1 million physicians, and 920,000 hospital beds, yet 27.6 million are uninsured and 100 million carrying medical debt (AHA, Census, KFF/Peterson 2023-2024).
The Universal Pattern
Abundant capacity exists
More than enough for everyone.
Concentrated at the top
Hoarded beyond functional use.
Scarcity at the bottom
Millions lack access despite abundance.
The gap is manufactured scarcity through resource hoarding.
American Gluttony Has Nothing to Do With Appetite
Gluttony is not comfort, pleasure or even wealth itself. At its core, gluttony is the accumulation of far more than one can use while others are left without enough to live securely.
Measured this way, gluttony becomes less a private vice and more of a public structure.
If the threshold for an abundant life is roughly $110,000 in resource value, then a household holding $1.5 million is not merely living above that threshold. It is holding nearly $1.39 million beyond what is required for functional security at the same time that millions of other households remain below it.
The moral question is not whether people should be punished for doing well. It is whether any society can call itself successful when its systems allow excess to compound at the top while insecurity remains the normal condition for everyone else.
This is where gluttony becomes structural. It is built into economic arrangements that reward extraction and accumulation without a meaningful limit, even when the additional resources no longer serve a functional human need.
The result is scarcity produced elsewhere: deferred medical care, unstable housing, unpaid bills, overextended parents, delayed retirements and households kept permanently one emergency from collapse.
The third quintile of American households, earning between $62,000 and $101,000, sits just below the abundance threshold.
These households hold roughly $100,000 in resource value, leaving them about $10,000 short of the stability required to absorb ordinary disruption.
For them, a medical emergency, a job loss or a broken-down car can still become a financial crisis.
Redistributing just one-seventh of the excess resources held by the top 1 percent, about $200,000 per household, would be enough to close that $10,000 gap for the entire third quintile: roughly 27 million households, or 67 million people.
Even after that transfer, the top 1 percent would still hold approximately $1.3 million per household, nearly 12 times the abundance threshold.
That is the scale of the imbalance.
The Abundant Life Denied
Let's talk about what that $10,000 gap actually means for the Third 20%.
You're a family of four with household income of around $80,000. You're doing everything "right"—working full-time, paying bills and saving what you can. You're not poor by official standards. You're "middle class."
According to BLS Consumer Expenditure Survey data (2024), the average American household spends $78,535 annually on housing (33.4%), transportation (17%), food (12.9%), insurance & retirement (12.9%), and healthcare (7.9%). You're managing all of that. Barely.
But you're $10,000 short of abundance. And that gap is everything.
It's the difference between fixing the car when it breaks down and hoping it lasts another month. Between taking your kid to the dentist when they complain about tooth pain and waiting to see if it gets worse. Between having three months of emergency savings and living paycheck to paycheck. Between "we can handle this" and "one more thing and we're underwater."
You're one moderate crisis away from instability at all times.
The bottom 60% of American household earners live in this space. Below abundance, managing scarcity and making impossible choices between rent and healthcare, food and utilities, stability and survival. And we're told this is normal.
Yet, it isn’t normal. In fact, there is more than enough to go around—the charts prove it.
The Moral Clarity
Here's where we need moral clarity instead of economic jargon. Scarcity is gluttony. When 176 million Americans live below the abundance threshold while the top 1% hoards resources valued at fourteen times that threshold, the scarcity isn't natural—it's manufactured by excess.
This isn't a "both sides" issue nor is it a matter of different economic philosophies or political preferences. This is a matter of observable reality:
We have enough housing, it's vacant. We have enough food, we waste it. We have enough wealth, it's hoarded.
We have enough resources for everyone to live abundantly. They're just concentrated in so few hands that millions go without.
The bottom 60 percent of household earners live with financial instability because American systems reward unlimited accumulation at the top while treating poverty as a failure of individual responsibility.
The result is an economy that protects extraction, legitimizes inequality and asks the people with the least margin to carry the blame for conditions they did not create.
The Path Forward: Universal Abundance Income
For years, Universal Basic Income has been discussed as a way to soften the financial instability faced by lower-income households. The premise is useful: people need cash, and cash gives households more flexibility than many means-tested programs.
But a basic income alone does not answer the scale of the problem. The issue facing the bottom 60 percent of American households is not only a shortfall in monthly income. It is a structural absence of security. Millions of households lack the resources required to live without constant exposure to crisis.
A more honest policy would begin with the threshold itself.
Call it Universal Abundance Income or Abundance Income Guarantee: a national commitment to ensuring that every household has access to the resources required for stability, dignity and full participation in society.
Under this framework, the goal is to bring households below the abundance threshold up to the minimum level of security required to live without persistent financial instability.
Universal Abundance Income
Scarcity Is Not a Resource Problem. It Is a Distribution Problem.
This model compares the abundance gaps and surpluses across American income groups, using a working abundance threshold of $110,000 in household resource value. The bottom 60% of households fall below that threshold, while the highest income groups hold trillions in excess abundance.
Bottom 60%
$6.3T
Estimated total gap needed to bring the bottom 60% of households to the abundance threshold.
Top 1%
$11.7T
Estimated excess abundance held by the wealthiest 1% above the abundance threshold.
Top 10%
$9.7T
Estimated excess abundance held by the top 10% above the abundance threshold.
| Income Group | U.S. Population | Per-Household Surplus / Gap | Total Surplus / Gap |
|---|---|---|---|
| Top 1% | 8.4M | +$1,390,000 | +$11.676T |
| Top 10% | 33.6M | +$290,000 | +$9.744T |
| Top 20% Net | 41.5M | +$140,000 | +$5.810T |
| Fourth 20% | 76.4M | +$33,000 | +$2.521T |
| Middle 20% | 66.6M | -$10,000 | -$666B |
| Second-Lowest 20% | 59.2M | -$42,000 | -$2.486T |
| Bottom 20% | 47M | -$67,000 | -$3.149T |
The pattern is stark: the resource gap for the bottom 60% totals roughly $6.3 trillion, while the surplus held by the highest income groups exceeds that amount many times over.
The middle 20 percent of households are roughly $10,000 short of the abundance threshold. The second-lowest 20 percent are about $42,000 short. The bottom 20 percent are about $67,000 short. Together, closing those gaps for the bottom 60 percent would require approximately $6.3 trillion.
That number is large because the crisis is large. It is also smaller than the surplus held at the top.
By imposing an excess resource tax on households above the abundance threshold, the United States could fund a national abundance floor. One possible structure would include:
a 30 percent excess resource tax on the top 1 percent of households
a 20 percent excess resource tax on the top 10 percent, excluding the top 1 percent
a 15 percent excess resource tax on the top 20 percent, excluding the top 10 percent
Based on this model, those taxes would generate roughly $6.3 trillion annually, enough to close the abundance gap for the bottom 60 percent of U.S. households.
The principle is simple: resources far beyond functional need should be redirected toward households still living below the threshold of security.
This would not eliminate grief, illness, loss or the ordinary difficulties of human life. It would eliminate a form of economic precarity that policy has allowed to become normal.
It would mean that a broken car does not become an eviction notice, that medical care does not become a debt trap, that child care does not force parents out of work, and that food, housing and utilities are no longer treated as privileges reserved for those who can survive an increasingly unforgiving economy.
The proposal is radical only in relation to a status quo that has made instability ordinary. In the richest country on earth, the continued existence of mass financial instability is a political choice.
A Universal Abundance Income would establish security as the floor of American life.